INTEGRATED COMMUNICATION SYSTEM
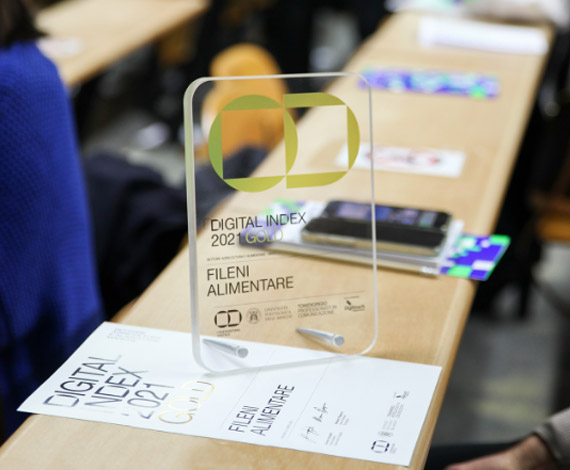
DIGITAL INDEX
OD - OSSERVATORIO DIGITALE
ANCONA
2022
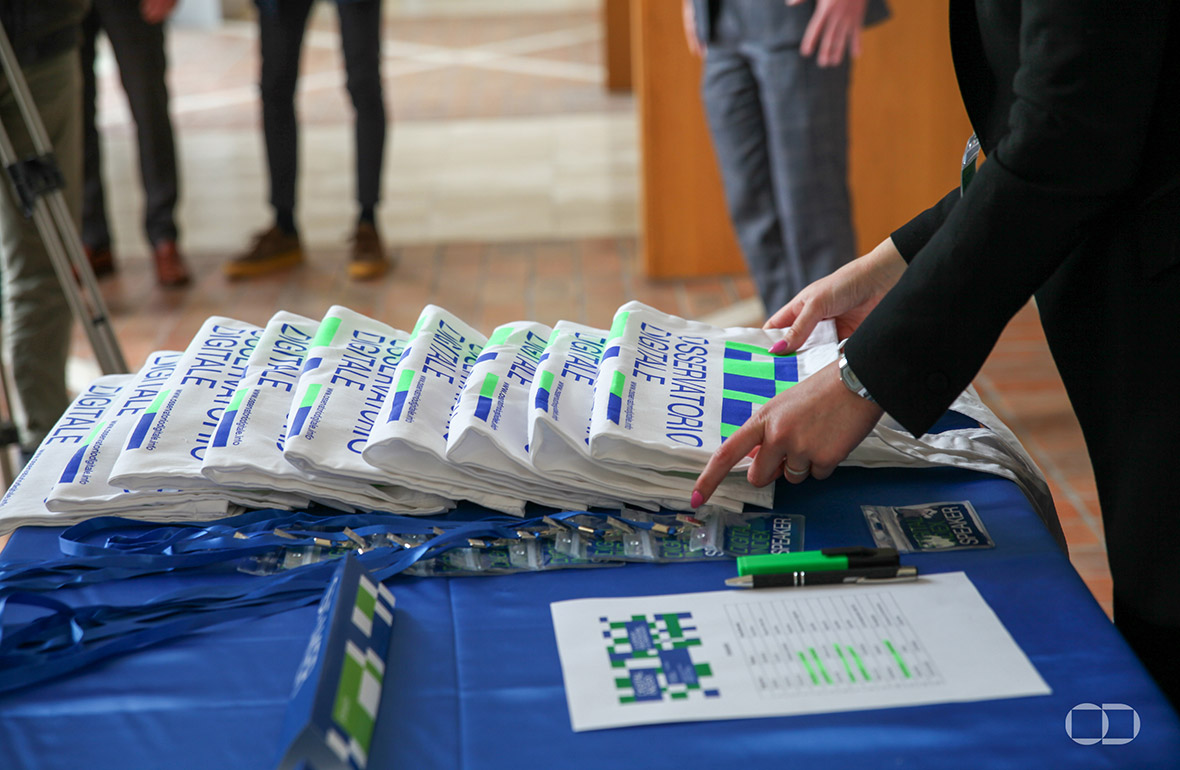
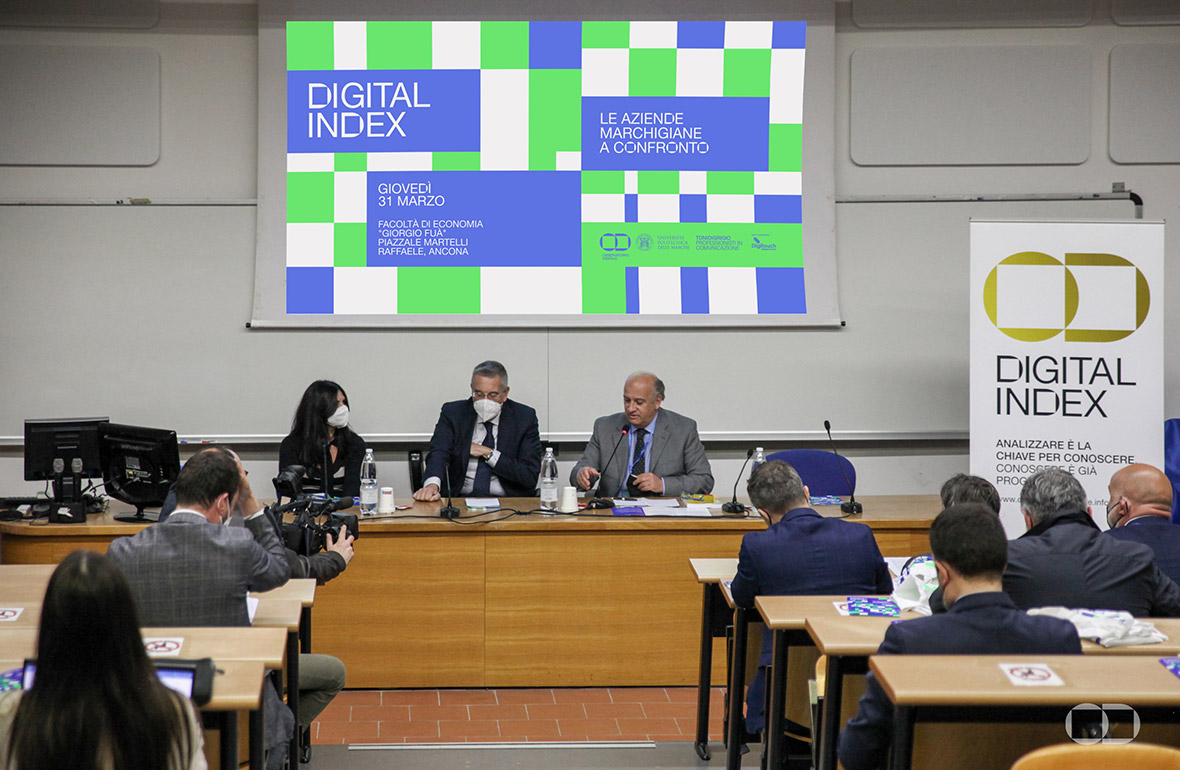
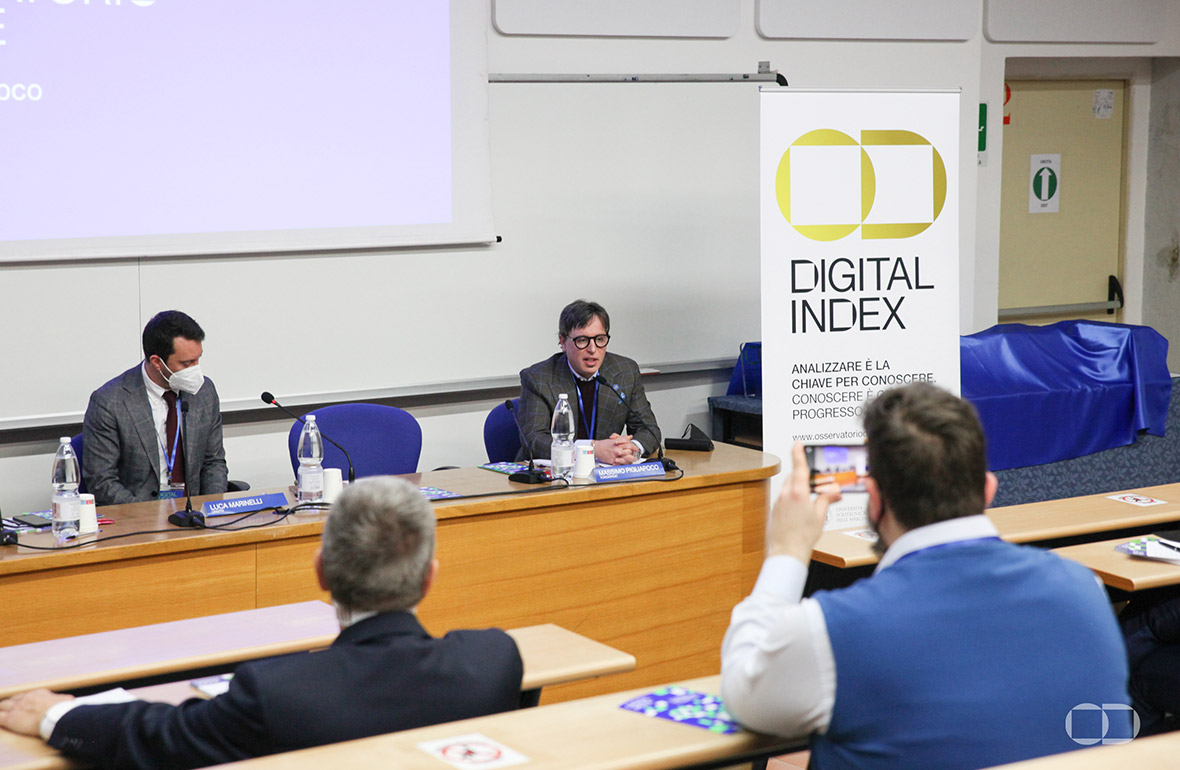
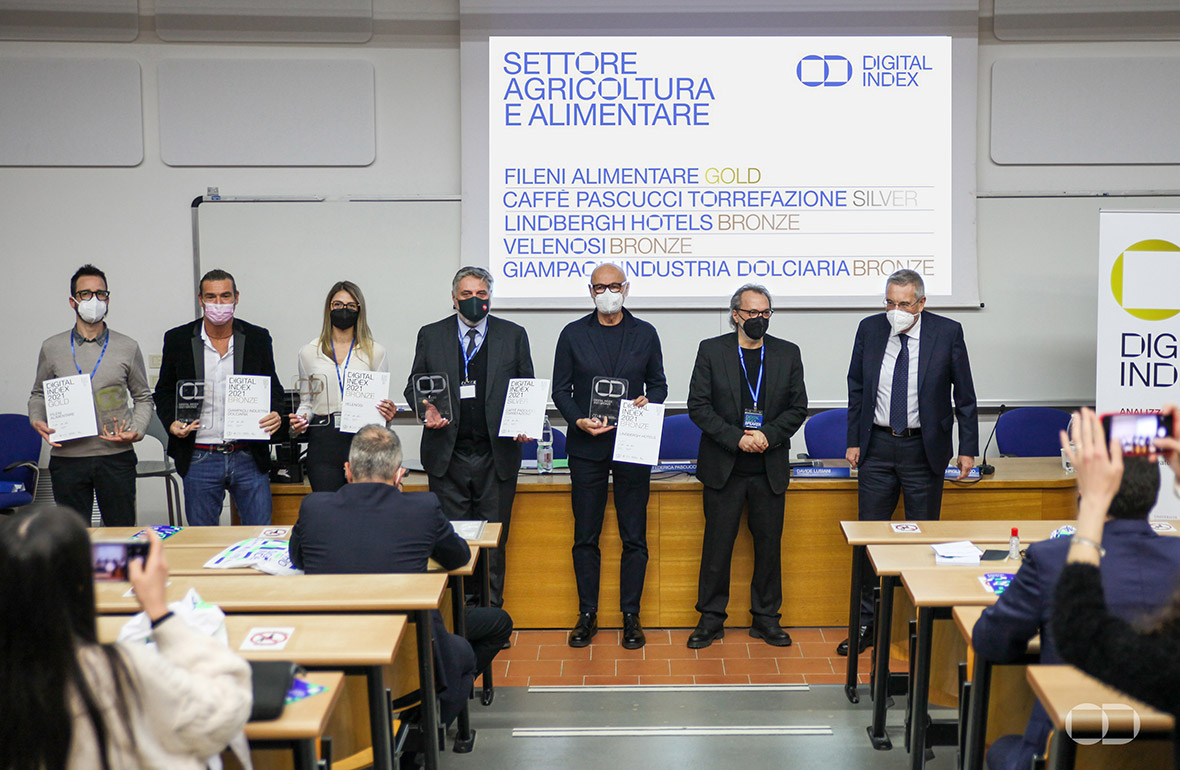
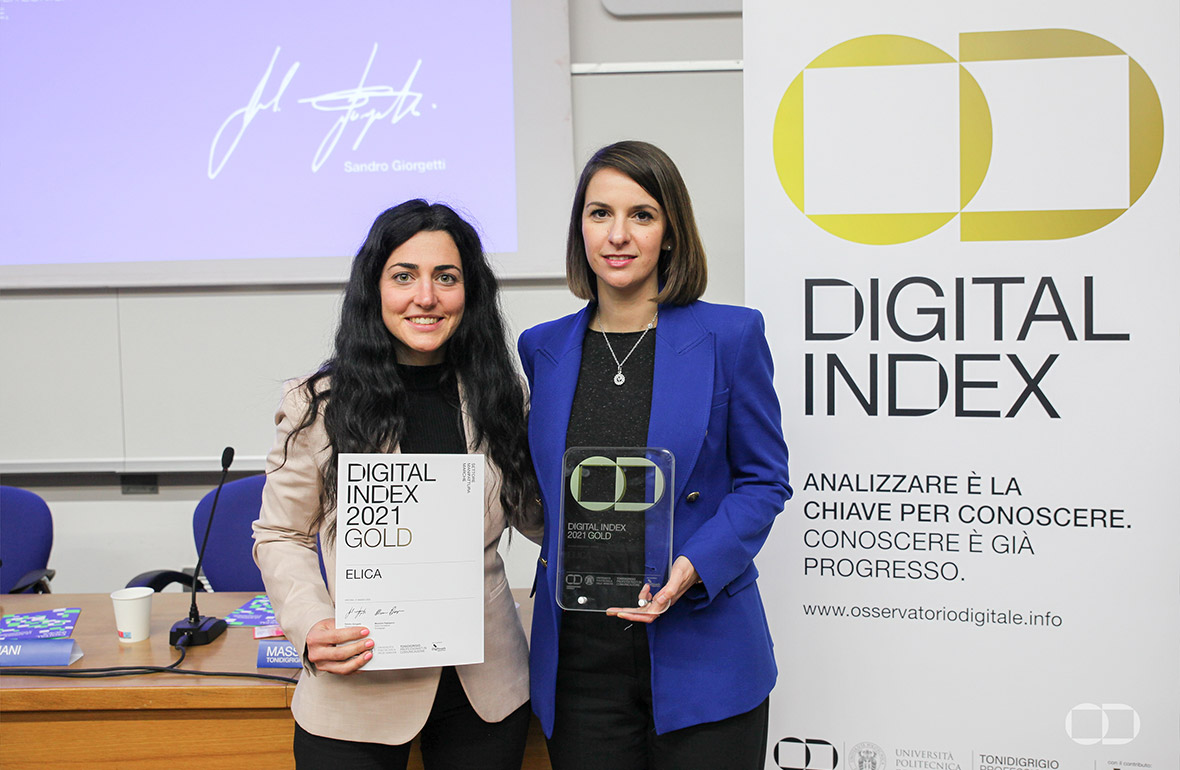
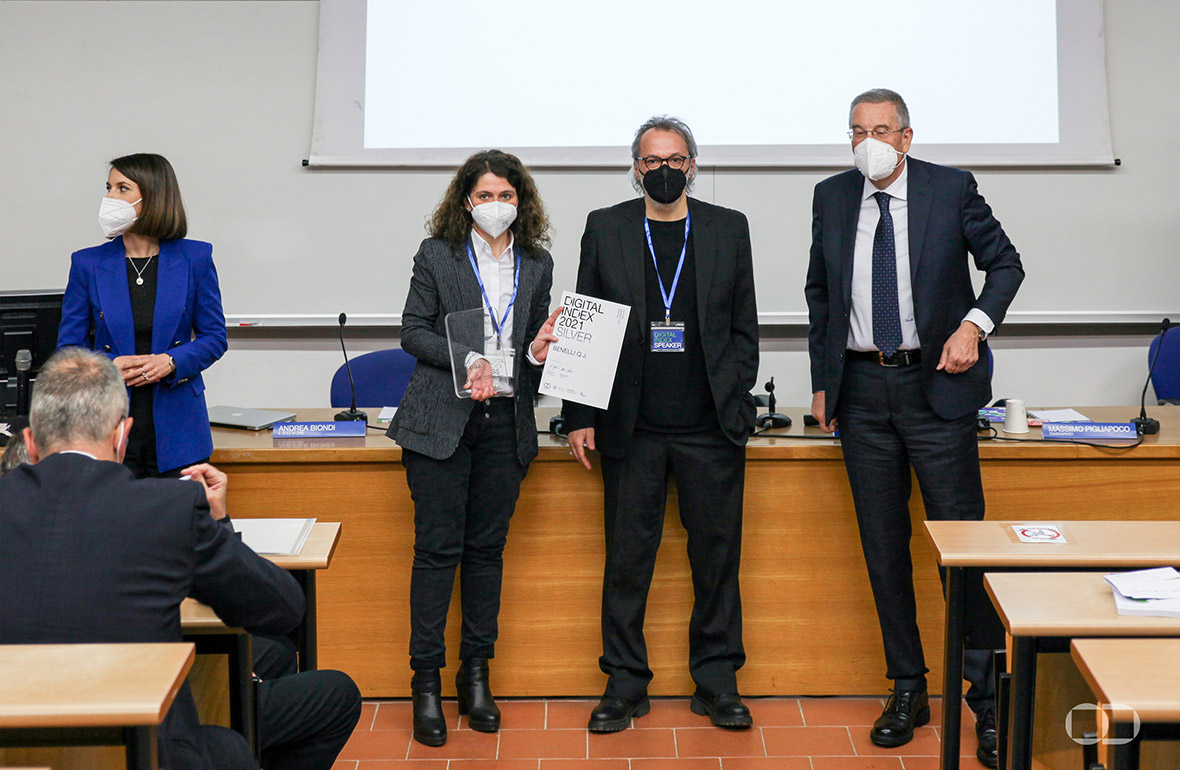
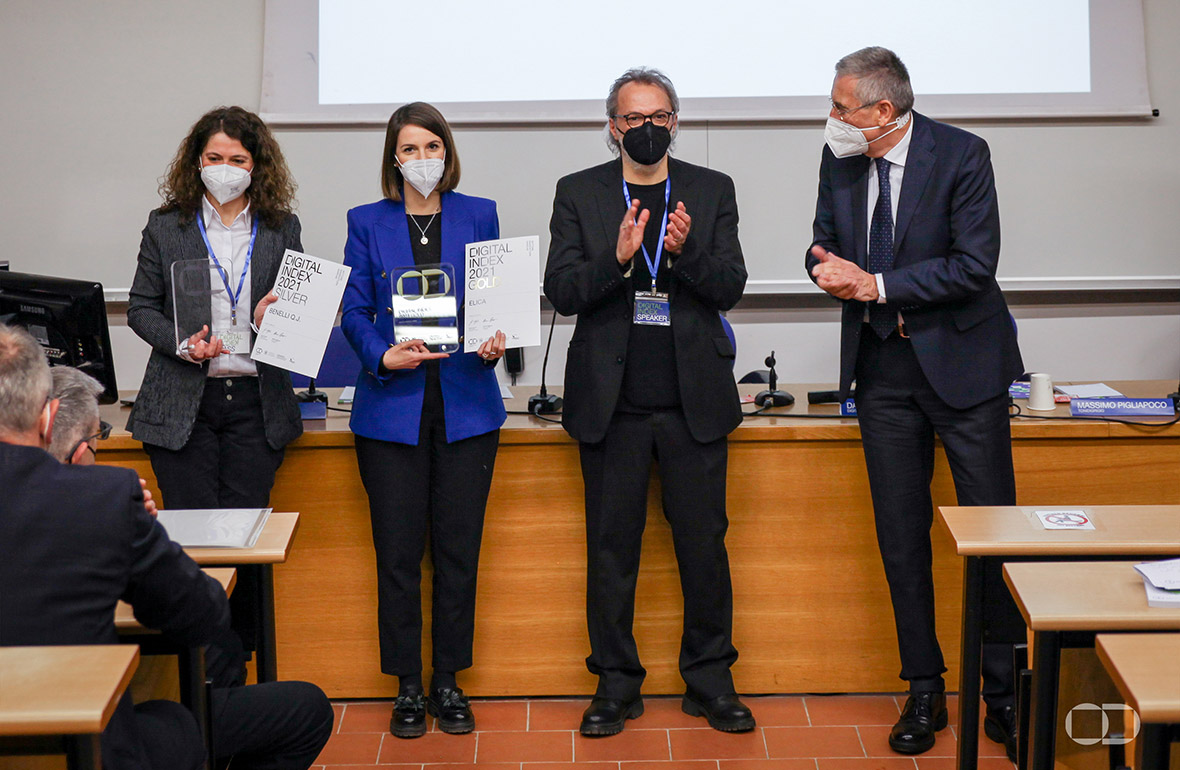
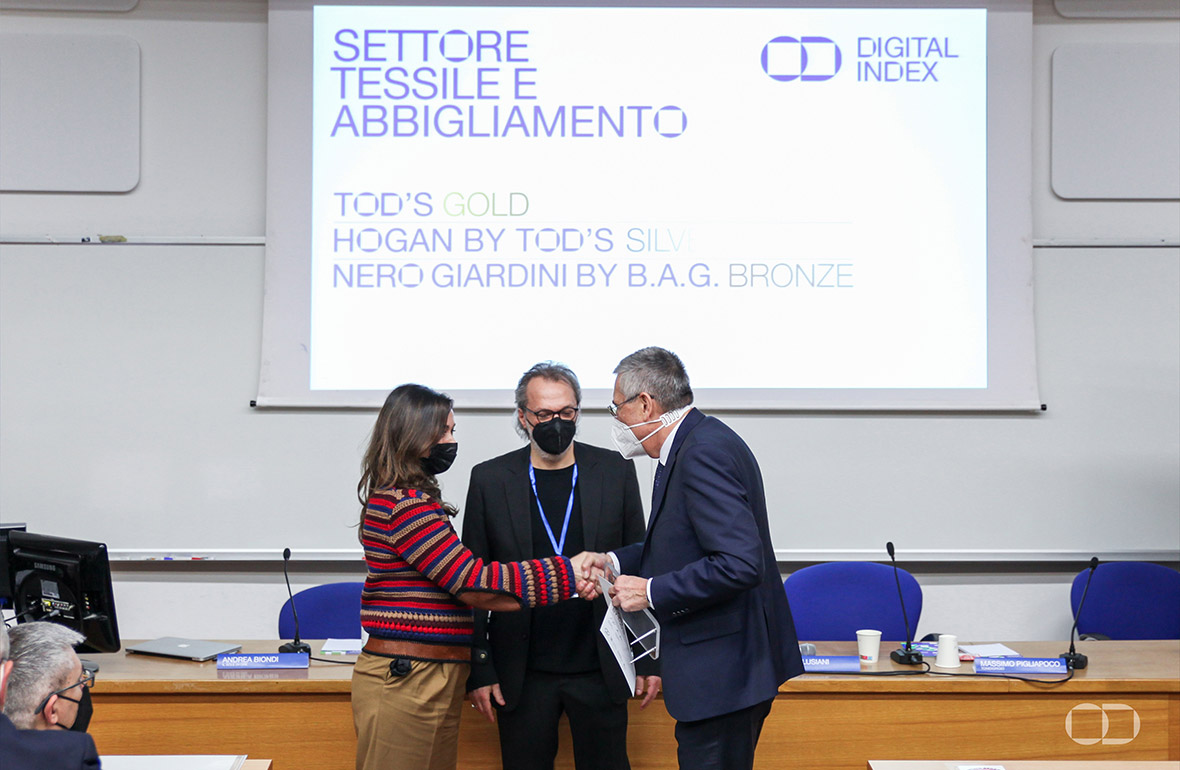
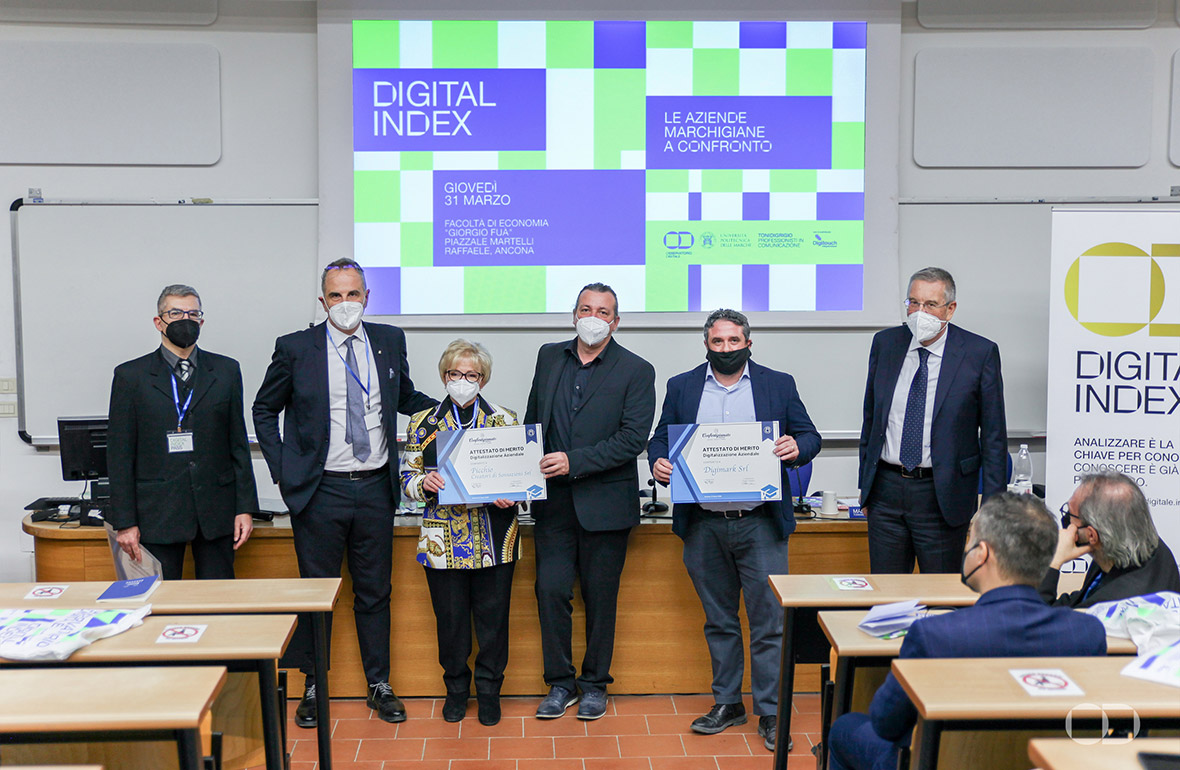
An official event presenting the research on the state of digitalisation of companies in the Marche region.
The results emerging from the presentation are analysed by distinguished guests taking part in a round-table discussion, during which key topics are explored and future perspectives are outlined. The study — the first of its kind conducted across such a wide territory — is based on an in-depth analysis of data and performance related to the digital marketing activities of companies in the Marche region.
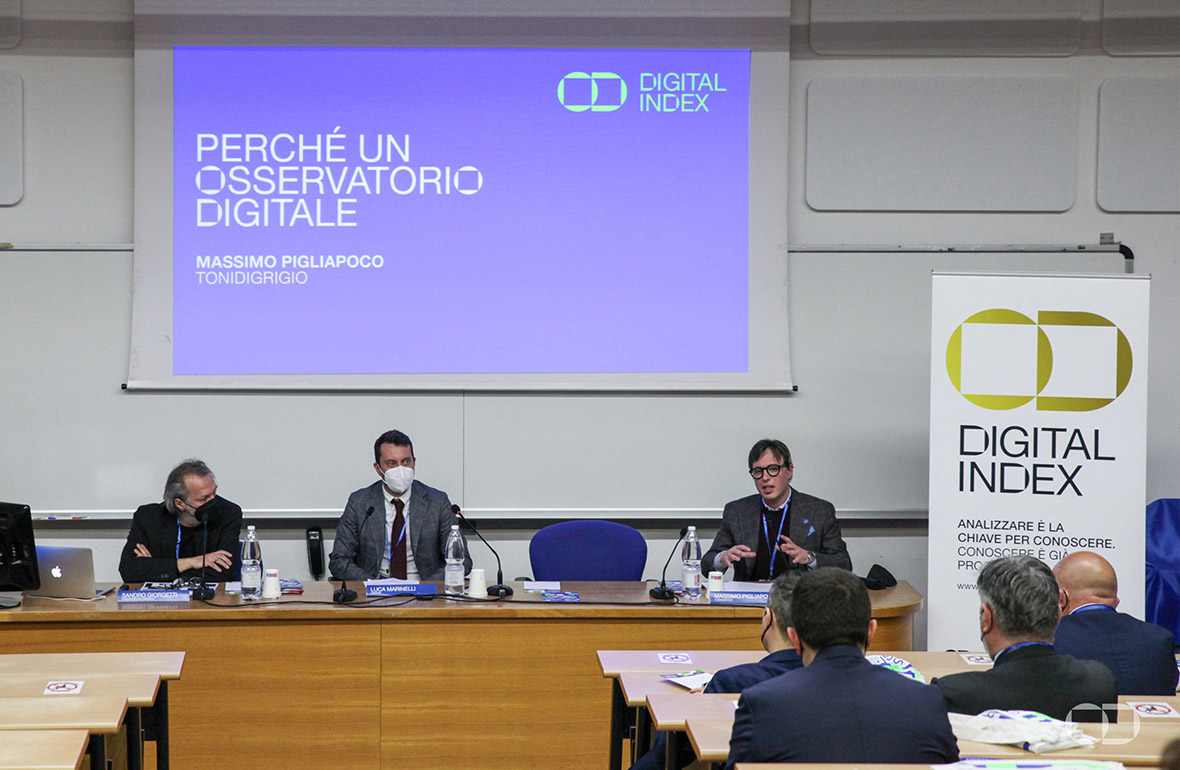
Digital Index: The digital presence of companies in the Marche region
Measuring the level of digitalisation across a territory as broad as an entire region requires appropriate organisation and tools, but above all a strong ethical objective.
DOWNLOAD THE RESEARCH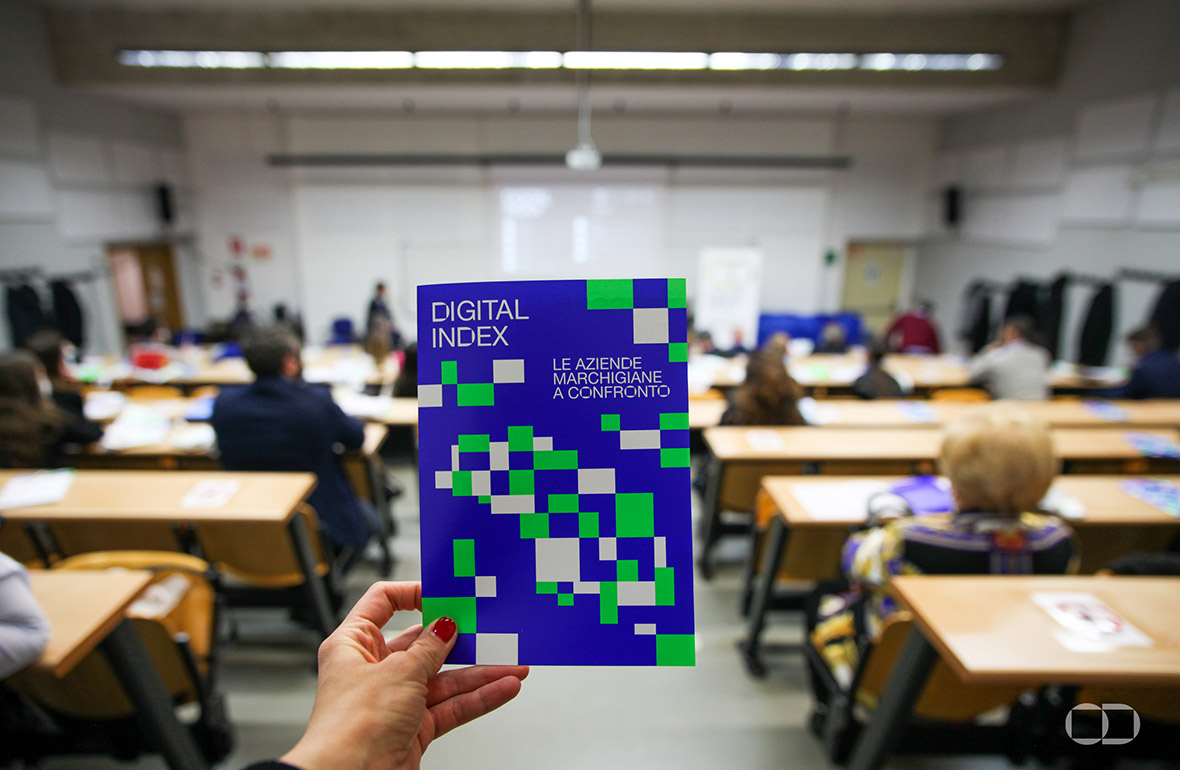


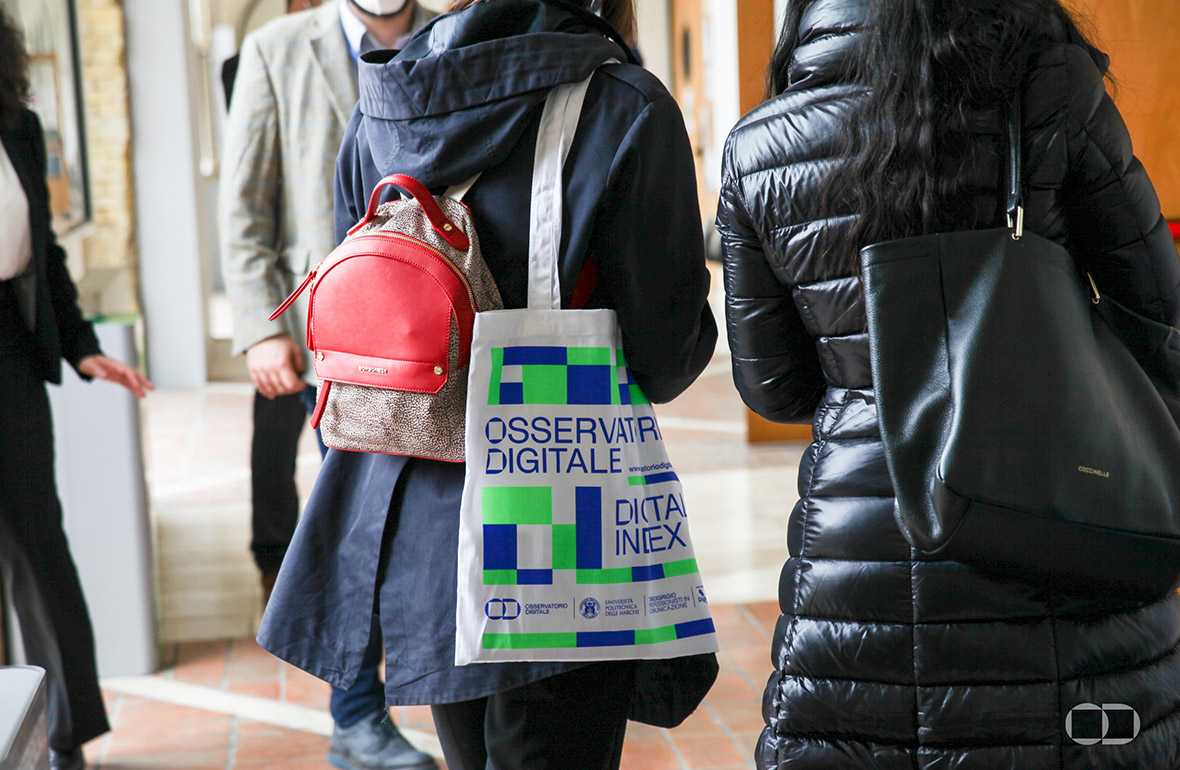


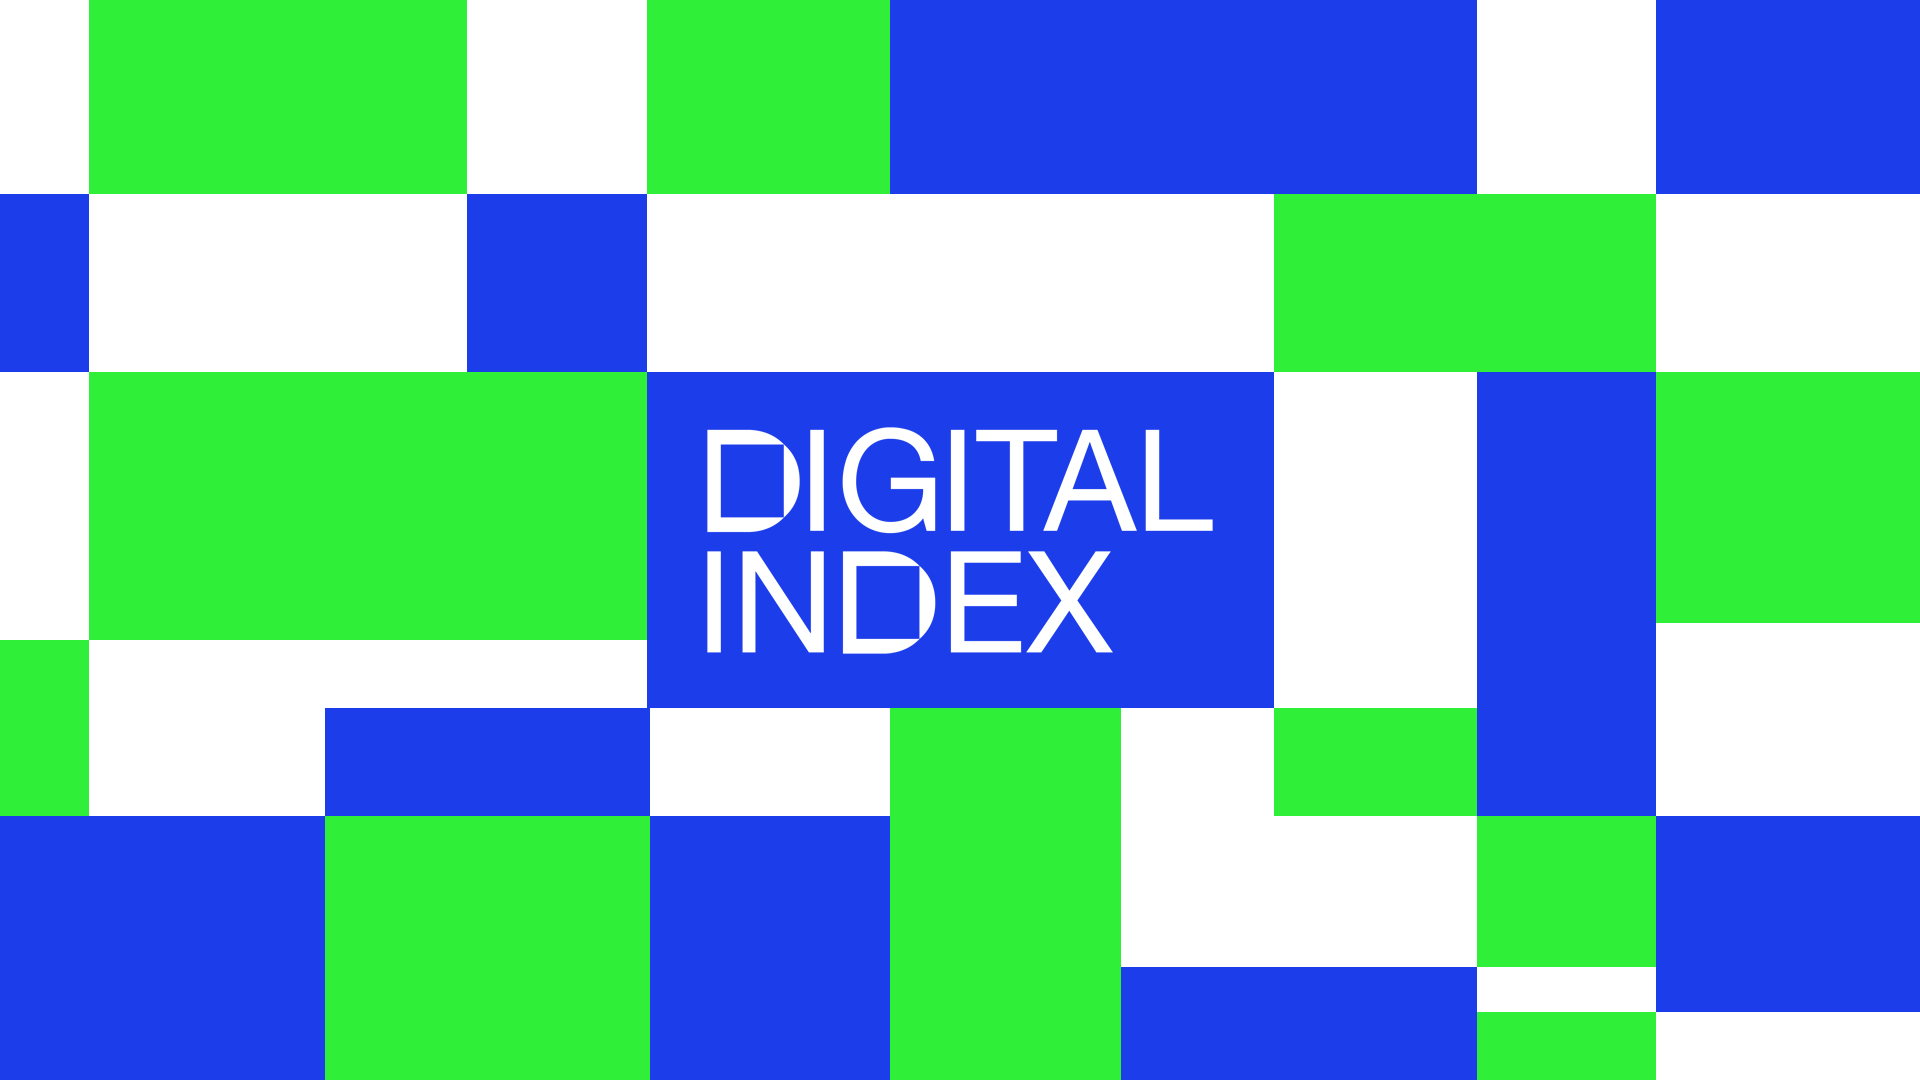
BRAND AND CUSTOM TYPOGRAPHY
Just as the DIGITAL INDEX event originates from the well-established institution of the Digital Observatory, its brand identity naturally derives from the Observatory’s visual system. Custom typography acts as the common thread which unifies the two identity systems. Based on Helvetica Neue, the typeface modifies the “O” and “D” glyphs through subtraction, with a square element overlaid and removed from them. This customisation intuitively connects the typography to the rest of the visual development for DIGITAL INDEX.


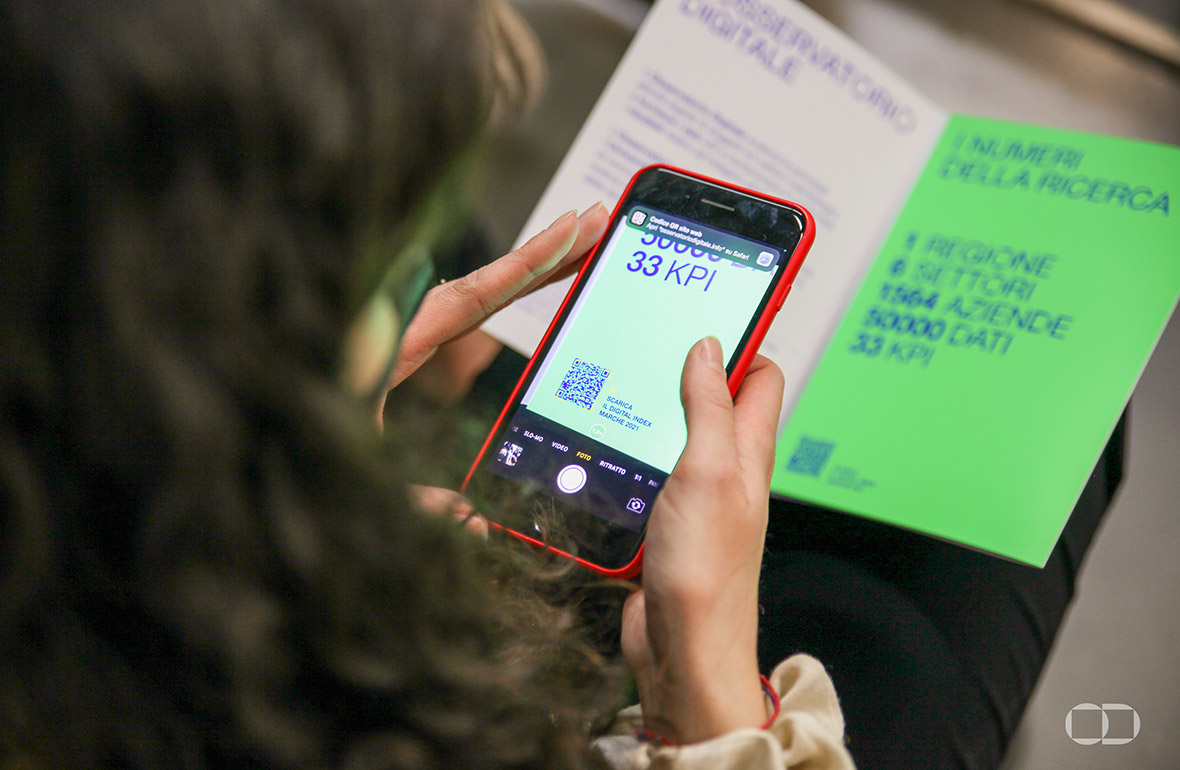
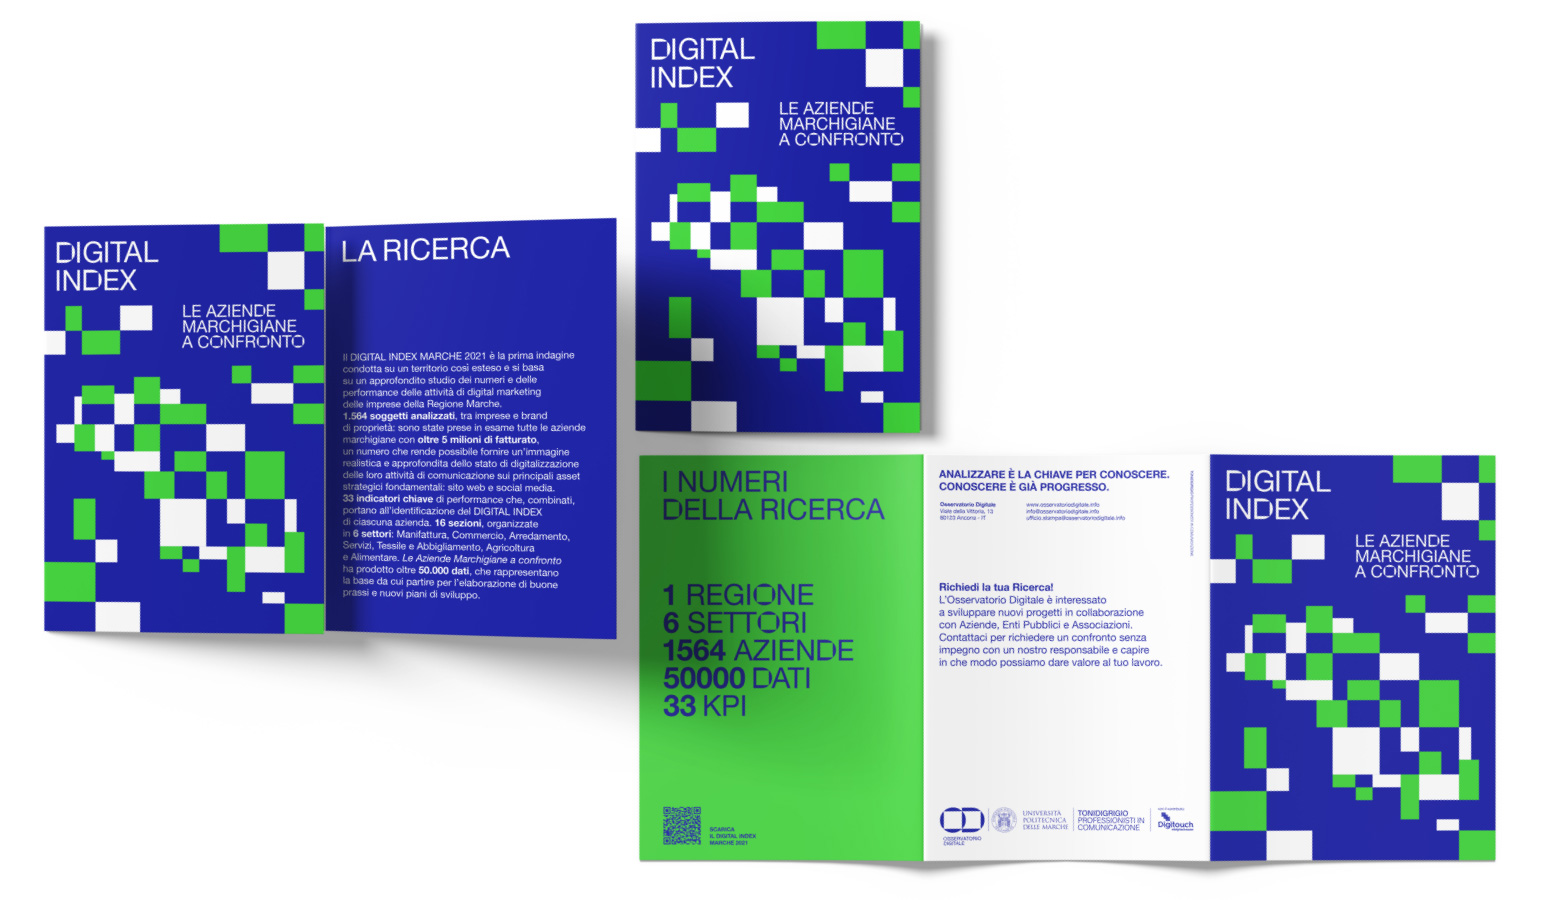
The DIGITAL INDEX MARCHE 2021 is the first study conducted across a territory of this scale and is based on an in-depth analysis of data and performance related to the digital marketing activities of companies in the Marche region.
A total of 1,564 entities were analysed, including companies and proprietary brands. All Marche-based companies with a turnover exceeding €5 million were examined, a sample size that makes it possible to provide a realistic and comprehensive picture of the level of digitalisation of their communication activities across the main strategic assets: websites and social media.
The study is based on 33 key performance indicators which, when combined, lead to the identification of each company’s DIGITAL INDEX. The analysis is structured into 16 sections, organised across 6 sectors: Manufacturing, Commerce, Furniture, Services, Textile and Apparel, and Agriculture and Food. Marche-based companies generated over 50,000 data points, forming a solid foundation for the development of best practices and new growth strategies.
1
region

+1500
companies analysed
from €5 mil.
turnover
33
KPI
+ 50,000 data
in total
16
sectors
6 macro sectors,
4 turnover ranges
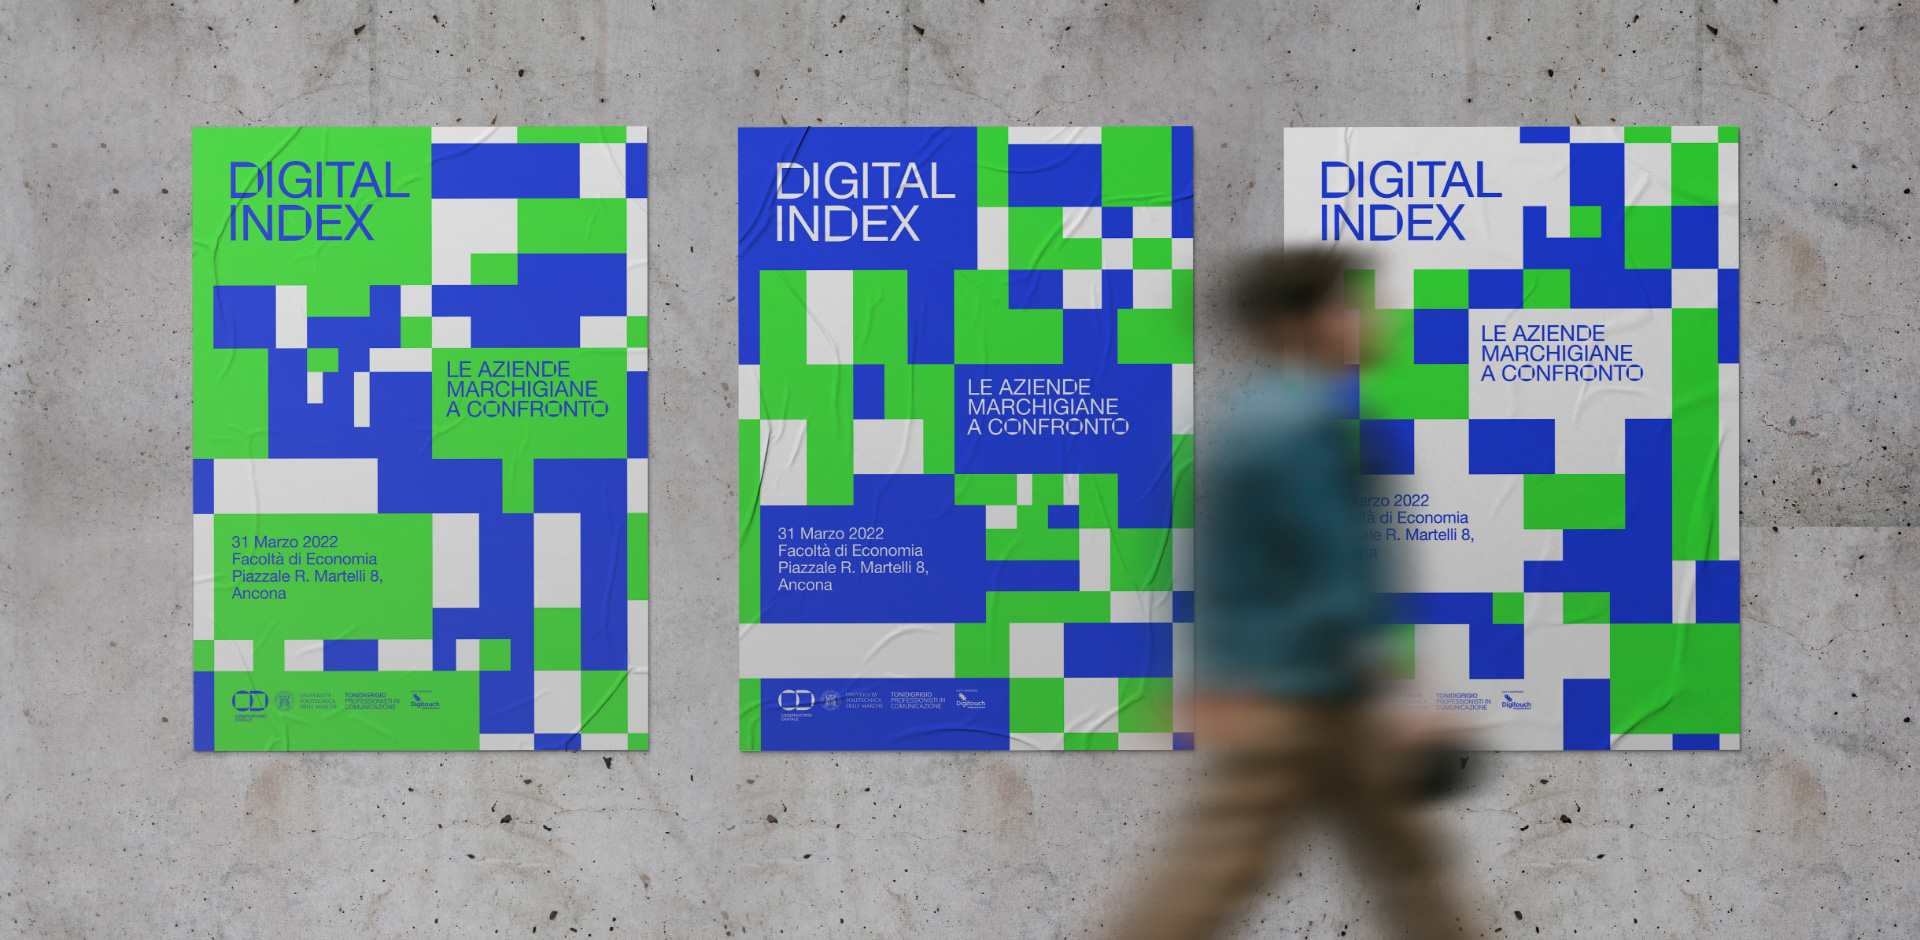
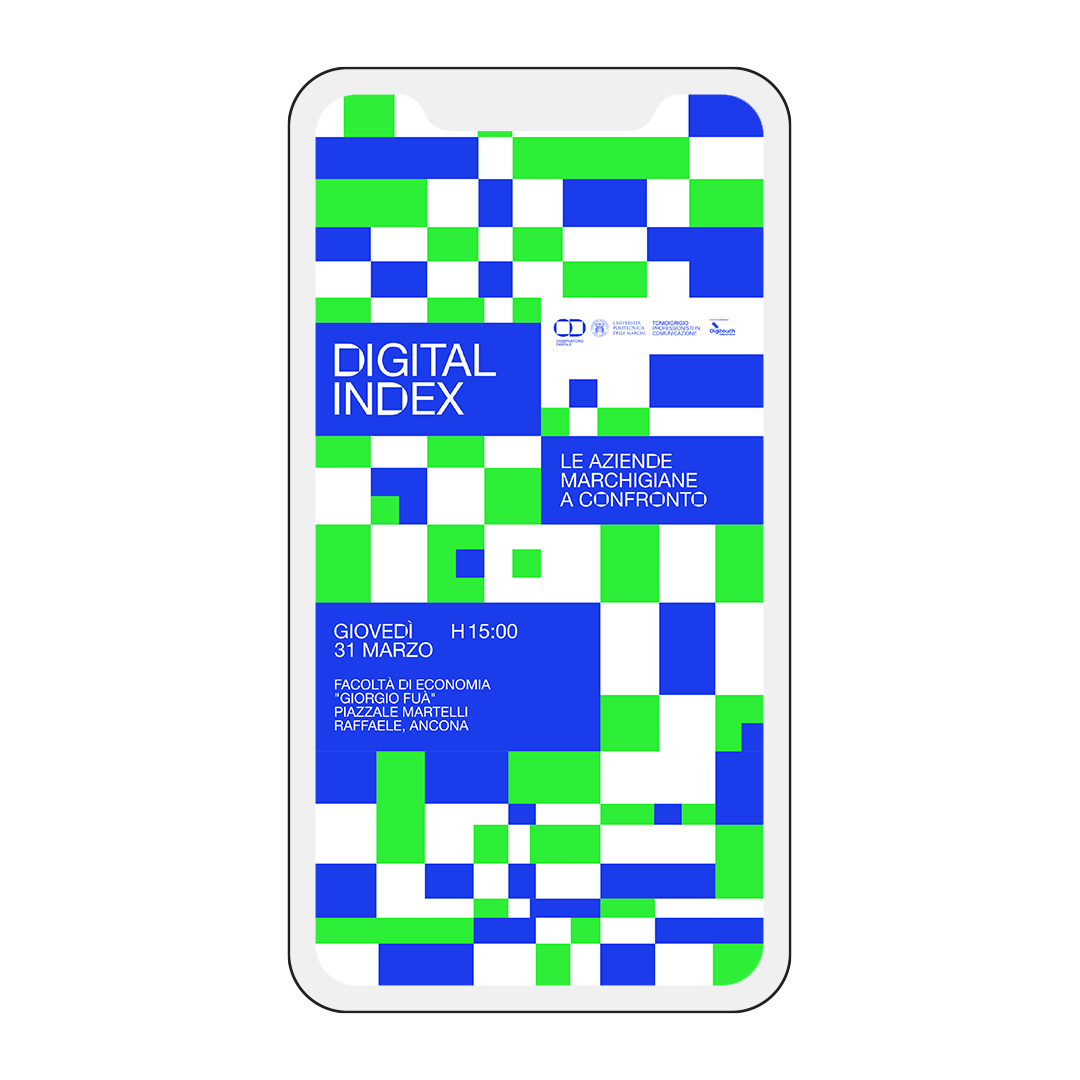
VISUAL AND GENERATIVE GRID
Data represents the structural backbone supporting the DIGITAL INDEX event. Its subsequent interpretation by the experts involved makes it possible to formulate meaningful hypotheses and forecasts. The visual representation of data is characterised by the widespread use of the rectangular element, often employed as a container or through a fragmentation logic. From this awareness, a geometric grid based on the square was developed, becoming a generative guide for all visual elements and for every required medium, both digital and physical.
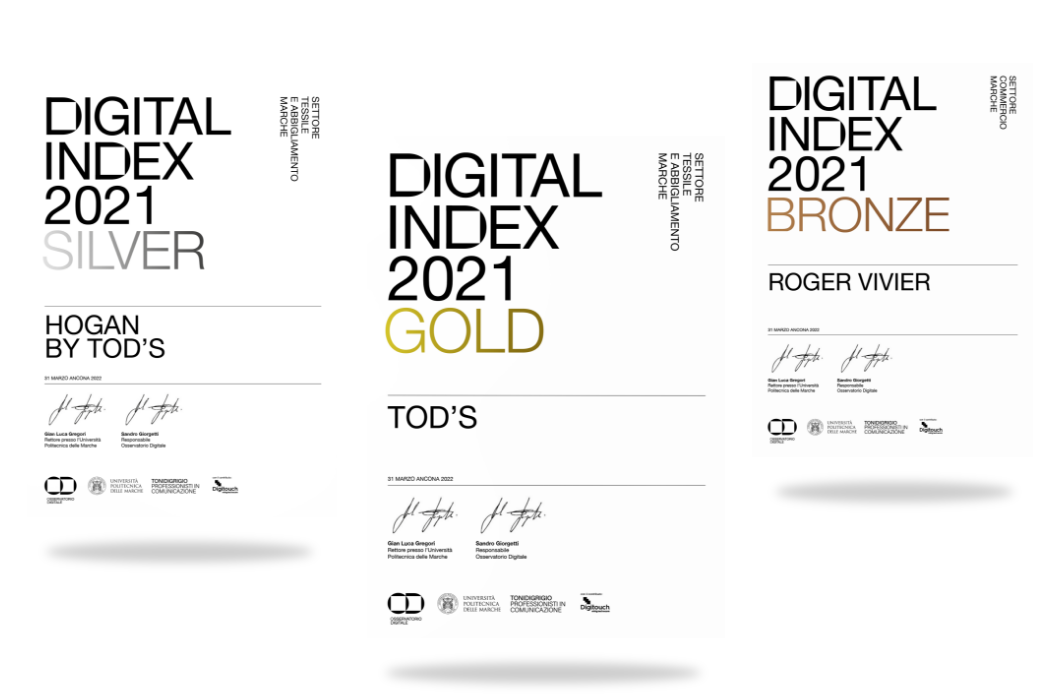
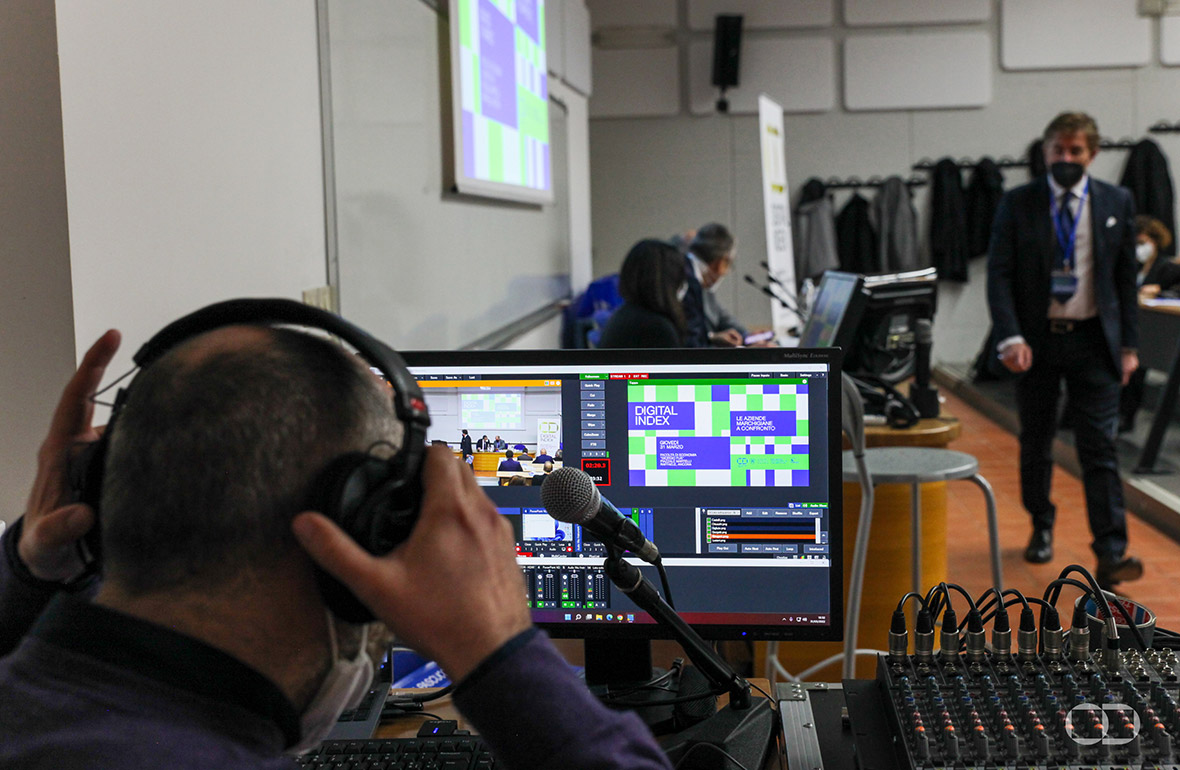
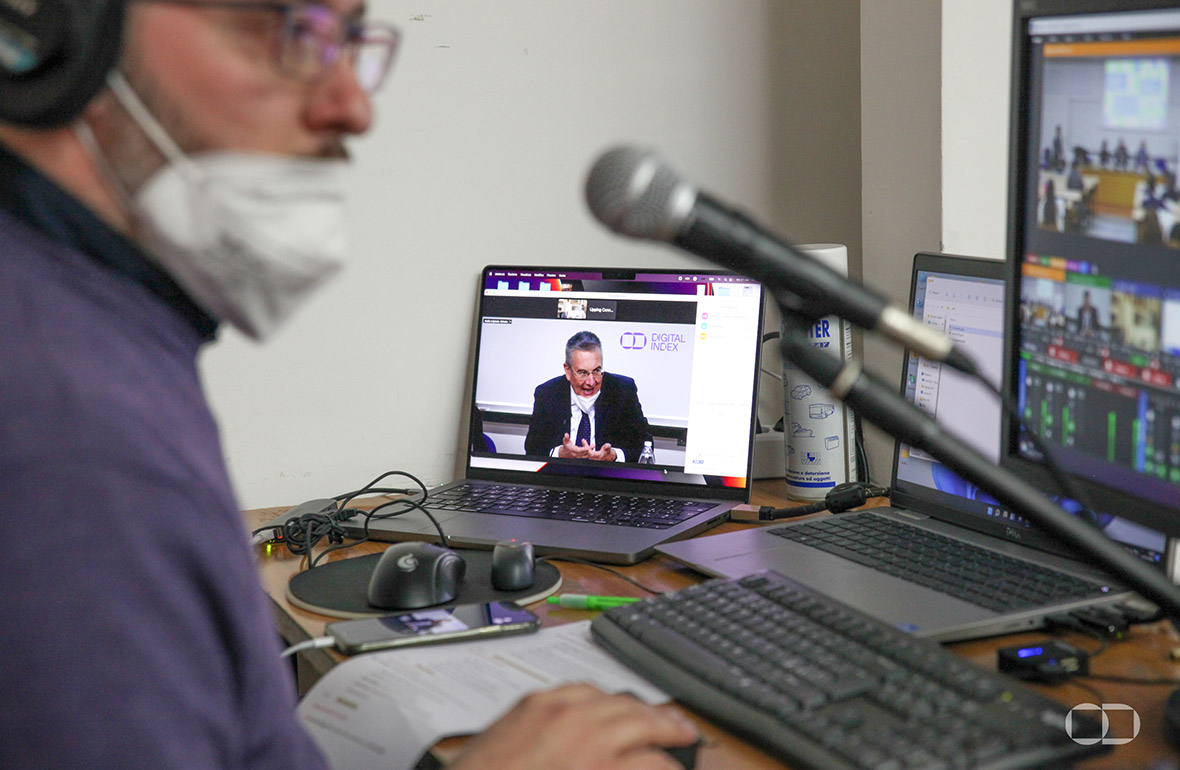
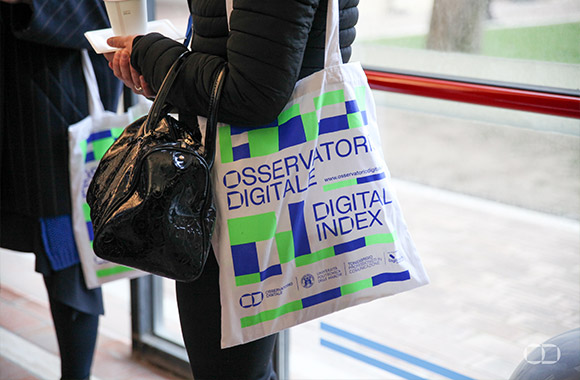
MULTICHANNEL ASSETS
The visual–narrative structure is clearly codified so it can be consistently applied across the various communication channels, while maintaining a dynamic and strongly distinctive approach. The modular grid is also scalable and responsive.
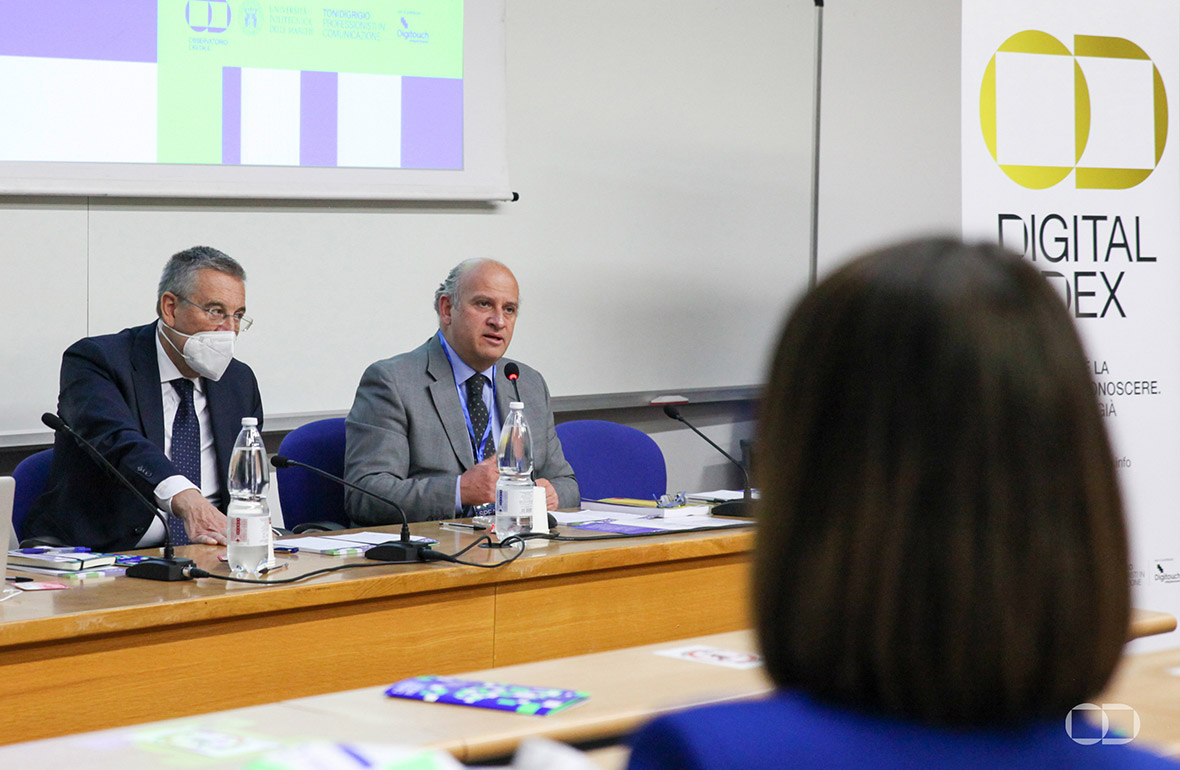
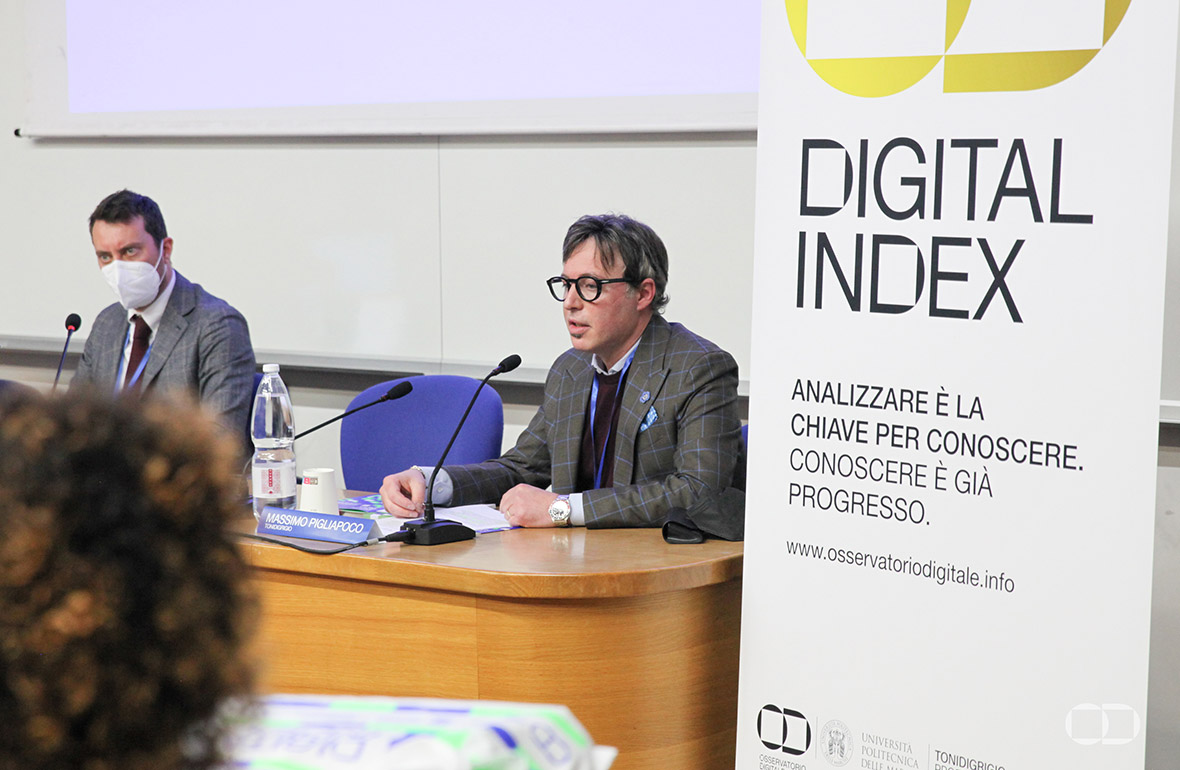
THE PROTAGONISTS
Through the visual grammar codified by the DIGITAL INDEX identity system, the photographs of the protagonists are translated into a pixel-based code, making them highly recognisable.
THE ALPHABET
DIGITAL INDEX makes use of a true alphabet — original and distinctive — designed to introduce key concepts through an iconographic language, breaking down and addressing the themes explored by the communication.


